Reading Candlestick Patterns Like a Pro
Understand the most common candlestick formations — from dojis to engulfing patterns — and what they signal about market direction.
Read ArticleLearn how markets move, why they move that way, and how to read the signals that professionals watch every single day.

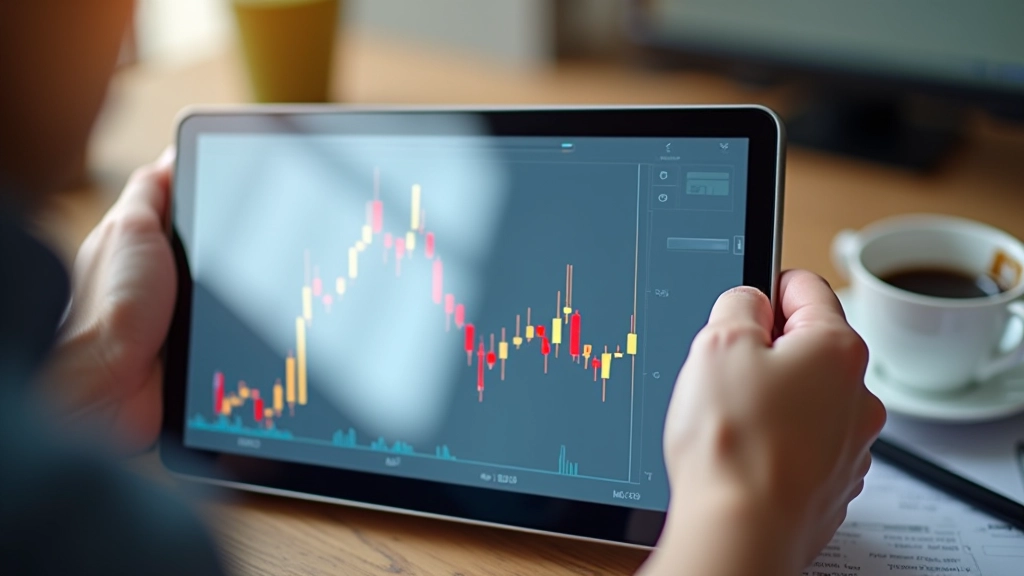
Price doesn't move randomly. Behind every tick, every candlestick, every support level is structure — patterns that repeat, levels that matter, and signals that traders use to make decisions. Understanding this structure is what separates people who guess from people who actually know what's happening.
We're not talking about complex formulas or secret indicators here. It's the fundamentals — how prices move in trends, where they bounce back, and how you can spot these patterns yourself. Once you see it, you can't unsee it. That's the real power.

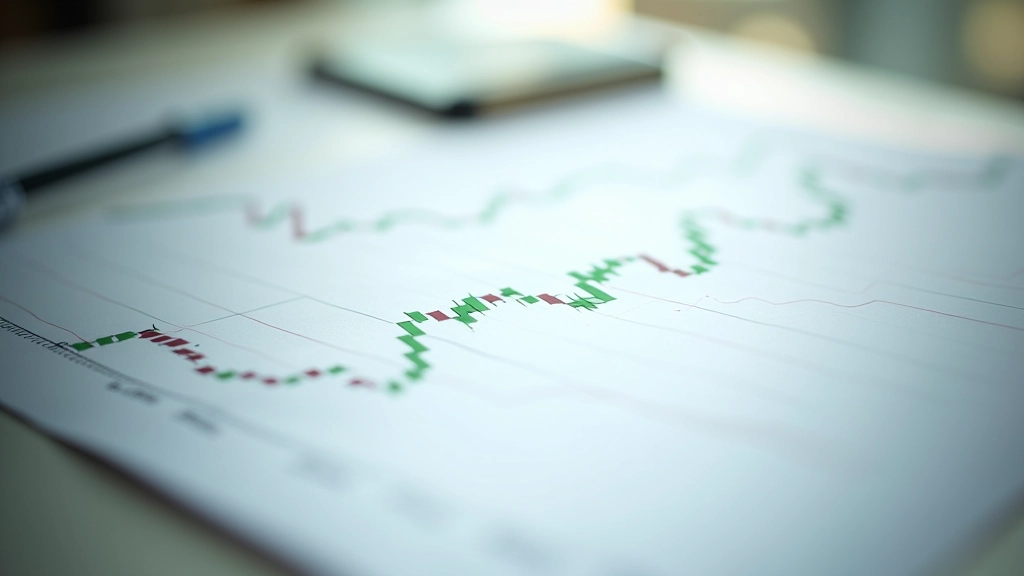
A trend isn't just a line going up or down. It's a series of higher highs and higher lows in an uptrend, or lower highs and lower lows in a downtrend. See the difference? In a proper uptrend, even when price pulls back, it doesn't go below the previous low. That's structure. That's what traders look for.
Sideways markets are different. Price bounces between a ceiling and a floor — support and resistance — without breaking either. These range-bound periods can actually be the cleanest to trade because you know exactly where the boundaries are. When price finally breaks out of that range? That's when things get interesting.


Support is where price bounces up from. Resistance is where it bounces down from. These aren't magical levels — they're psychological battlegrounds where buyers and sellers have clashed before. Once price bounces off a level twice, three times? Now traders are watching. Now it matters.
Here's what's important: a level becomes stronger the more times price touches it without breaking. If price bounces off support at 1.0850 five times over three weeks, that level has real significance. When it finally breaks? That's not random. That's a change in the market structure itself.
Broken support becomes resistance. Broken resistance becomes support. This flip happens constantly. Watch for it and you'll see the market's memory — where traders got burned, where they made money, where they're expecting the next move.
Price action is the language of the market. It's how price moves around those support and resistance levels, how it reacts to important moments, how fast or slow it moves. You don't need fancy indicators for this — just the price itself and how it behaves.
Strong price action looks like confident movement. Price breaks through a resistance level with volume, doesn't look back, keeps going. Weak price action? Price pushes up to resistance, hesitates, comes back down. That hesitation tells you something — uncertainty, rejection, lack of conviction. Professional traders see this and act on it.
"The chart shows you everything. What price does, where it goes, how it behaves — that's all the information you need. Most traders ignore it and chase indicators instead."
— Market Structure Principle
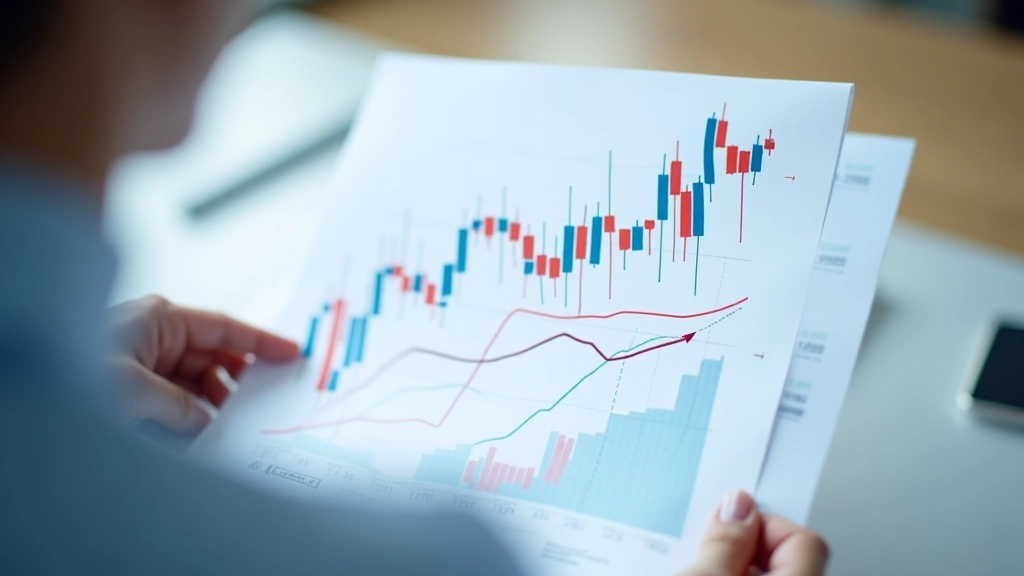
A breakout is when price violates a key level — breaks above resistance or below support. But here's the thing: not all breakouts are real. Some are fakes. Price breaks above resistance, traders jump in excited, then it crashes back down. That's a false breakout, and it happens constantly.
Real breakouts come with power. Volume increases. Price doesn't hesitate. It doesn't come back to test the old level immediately. These are the setups that can turn into substantial moves — especially in forex and commodity markets where volatility can compound quickly.
So you've got the concepts. Now what? Here's how professionals actually use this:
Look at the chart and determine if we're in an uptrend, downtrend, or sideways market. Don't fight the trend — trade with it.
Find where price has bounced before. Draw horizontal lines at support and resistance. These become your reference points.
When price approaches a key level, what happens? Does it bounce? Does it push through? How quickly? That's price action talking.
Before price gets there, decide what you'll do. If it breaks through, what's your plan? If it bounces, what's your plan? Have this mapped out first.
This isn't complicated. It's actually simpler than most people think. The challenge isn't understanding it — it's staying disciplined enough to follow what the chart is telling you instead of following your emotions.
Market structure and price action aren't optional concepts. They're the foundation. Everything else — order types, risk management, trade planning — builds on top of understanding how markets actually move. You don't need to be a chart expert to get this. You just need to practice seeing these patterns on real charts.
Open a chart right now. Pick any currency pair or commodity. Identify the trend. Mark the support and resistance levels. Watch how price reacts. That's it. That's your education starting right there.
Join our free webinar series and learn how professional traders read these signals in real market conditions. We'll walk through live examples and show you exactly what to look for.
Explore More ResourcesThis article is provided for educational purposes only. Understanding market structure and price action is foundational knowledge for trading, but it does not constitute investment advice or a recommendation to trade any particular instrument. Market conditions vary, and past patterns don't guarantee future results. Always research thoroughly, understand the risks involved, and consider consulting with a qualified financial advisor before making trading decisions. Forex and commodity markets carry significant risk and aren't suitable for all investors.
Understand the most common candlestick formations — from dojis to engulfing patterns — and what they signal about market direction.
Read Article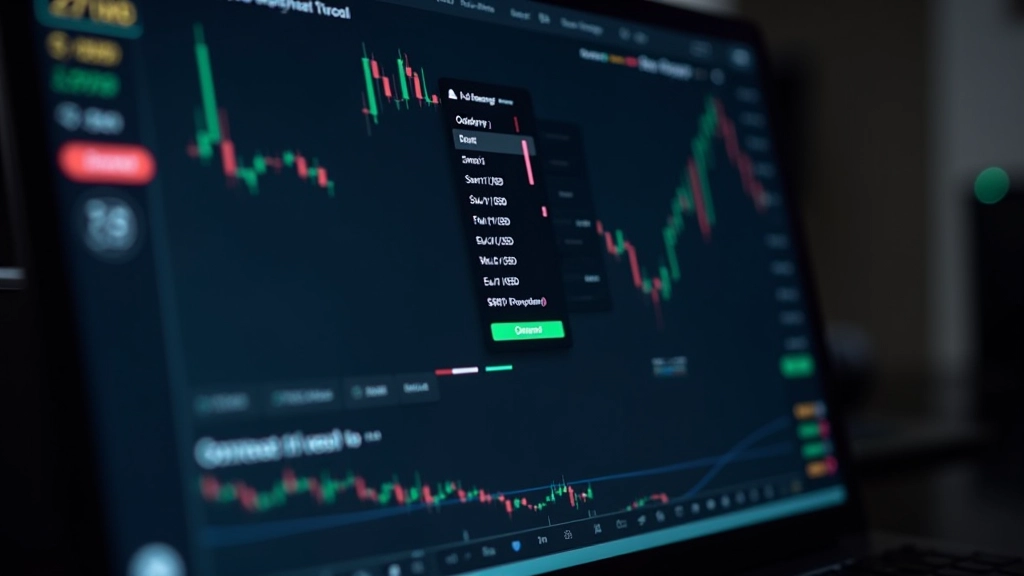
Learn the three essential order types every trader needs to know and when to use each one in different market conditions.
Read Article
Explore how commodity markets work, what drives price movements, and how to begin trading in metals, energy, and agricultural markets.
Read Article